Compliance Overview
The Compliance Overview page serves as an executive dashboard, providing a comprehensive view of compliance status.
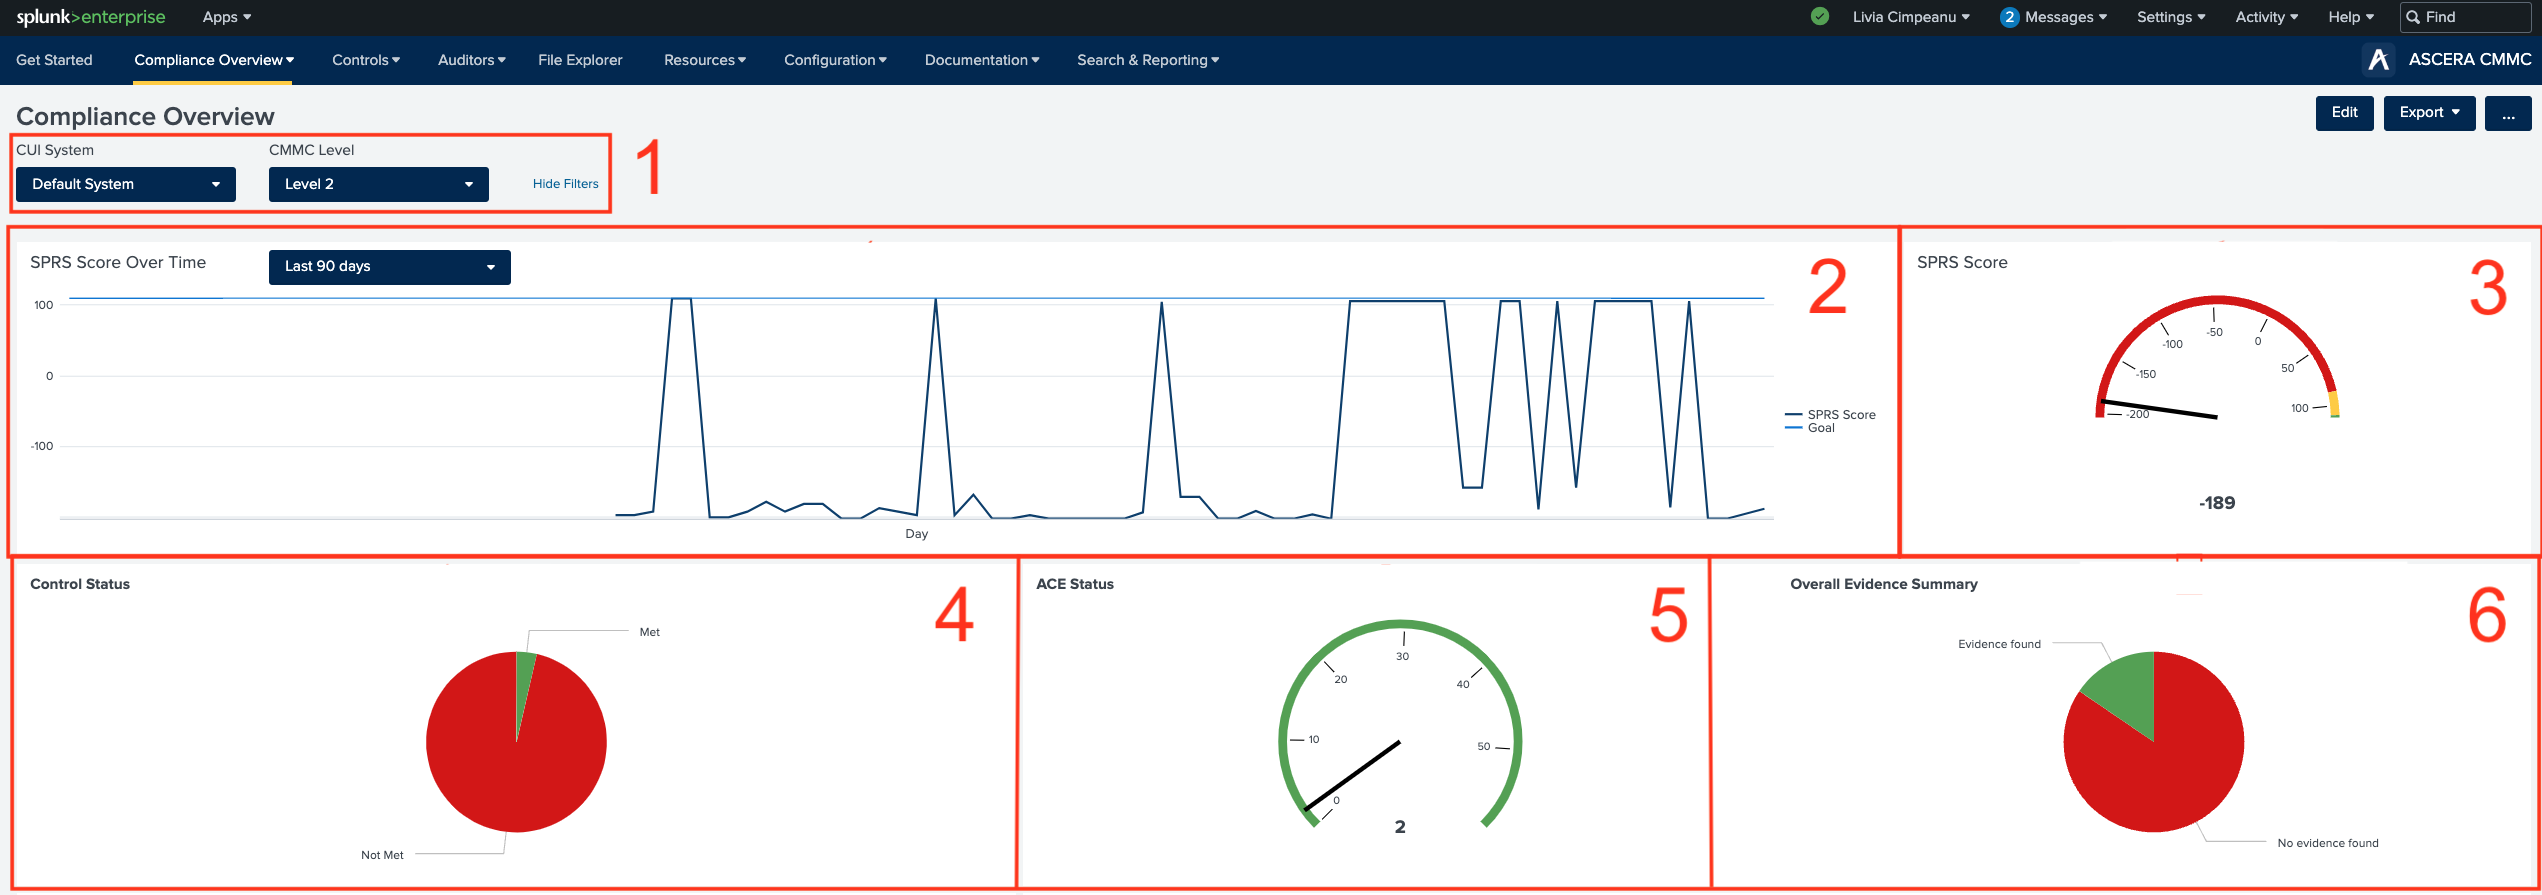
1. Filters
The filters are intuitive tools designed to streamline transitions between systems and differentiate CMMC Levels. The available filters include.
- CUI System
- CMMC Level
2. SPRS Score Over Time
This line chart shows the organization's SPRS score over time and the benchmark average of scores of contractors similar in size and discipline. The SPRS score measures a defense contractor's compliance with the cybersecurity requirements outlined in the DoD assessment methodology. SPRS stands for Supplier Performance Risk System, a database established by the DoD to track and assess supplier risk including the cybersecurity posture of its suppliers.
3. SPRS Score
The SPRS score gauge shows the organization’s score out of a maximum of 110 points and a minimum of -203. The SPRS score measures a defense contractor's compliance with the cybersecurity requirements outlined in the DoD assessment methodology. SPRS stands for Supplier Performance Risk System, a database established by the DoD to track and assess supplier risk including the cybersecurity posture of its suppliers.
4. Control Status
The pie chart provides an overview of the compliance status of an organization. It is divided into three main categories: Met Controls, Not Applicable (N/A), and Not Met Controls.
5. ACE Status
The ACE (Automated Collection of Evidence) status gauge indicates the number of ACE controls that are configured correctly and reporting in an “enabled” state. The automated evidence collection covers the entirety or a portion of a control.
6. Overall Evidence Summary
For all controls, this pie chart shows if evidence has been uploaded for every requirement objective or if evidence uploading to the objectives is incomplete. Furthermore, unassigned controls are shown to identify controls that have not been assigned a responsible party and evidence has not been uploaded.
7. Domain Overview
CMMC is broken down into 14 domains, and this radar chart shows the compliance status of each family within CMMC. Each family has a different amount of controls, so showing percentages helps identify strengths and weaknesses between domains to give insight into an organization’s security posture and maturity in different cybersecurity domains.
8. Controls by DoD Weight
The SPRS score is calculated from the value of each control based on the NIST 800-171 DoD assessment methodology. The values or weights consist of 1, 3, or 5 points. The controls weighted with the highest value (5) have the most impact on the security of an organization’s network or CUI data.
9. Key Metrics table
The dynamic table presents all 110 controls and has built-in features that filter the table based on different key metrics to help the users understand their stance with CMMC. For each metric, the user can click on it to drilldown into the details in the table below.
The key elements are:
- Upcoming Review - Counts the controls that are due to be reviewed in the next 30 days
- Review Overdue - Counts the controls that are past due for review by 30 days
- In Progress - Counts the controls that have been marked as in progress in the previous control review
- Not Met - Counts the controls that have the status Not Met
- Evidence Not Found - Counts the controls that don’t have any evidence uploaded
- Operator Unassigned - Counts the controls that don’t have an assigned Operator
- Recently Updated - Counts the controls that had any update made in the last 30 days