Compliance Trends
The Compliance Trends page is a dynamic and interactive dashboard designed to assist users in tracking and analyzing their compliance status trends over time. This tool empowers users to adapt and refine their strategies for achieving the CMMC based on real-time insights.
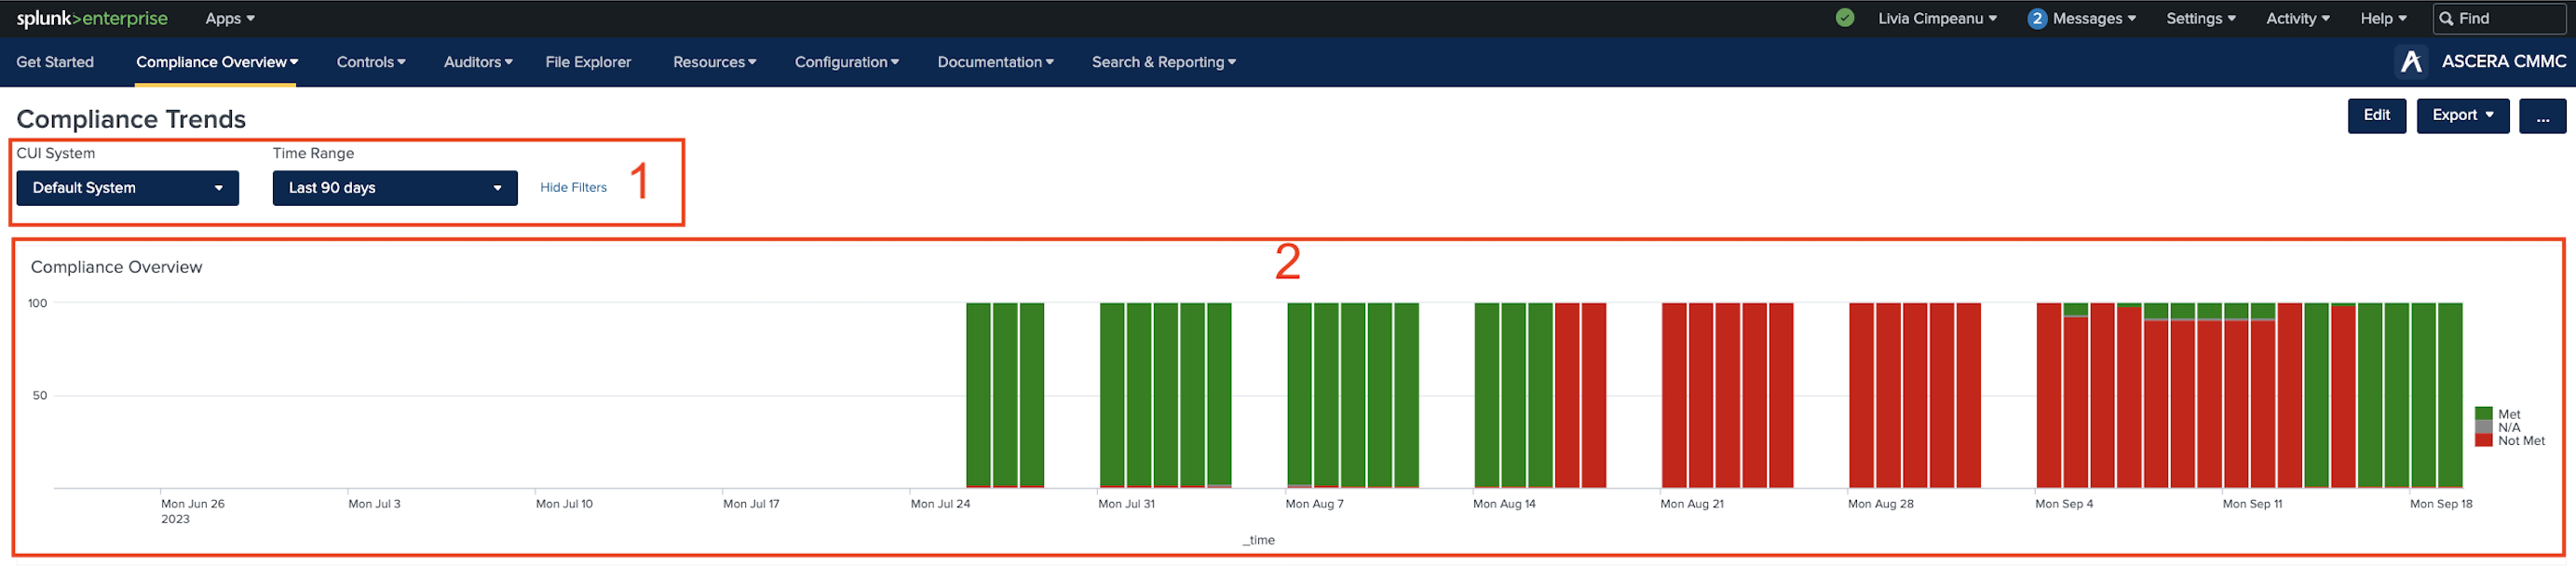
1. Filters
The Compliance Trends page provides a set of comprehensive filters, enabling users to fine-tune the information displayed on the page. Users can gain specific insights into the status trends of CUI Systems and selectively filter data based on their preferred time periods.
2. Compliance Overview chart
The Compliance Overview chart is a visually informative bar chart that illustrates the evolution of met and not met controls over time. This chart offers a clear and concise overview of an organization's compliance status trends.
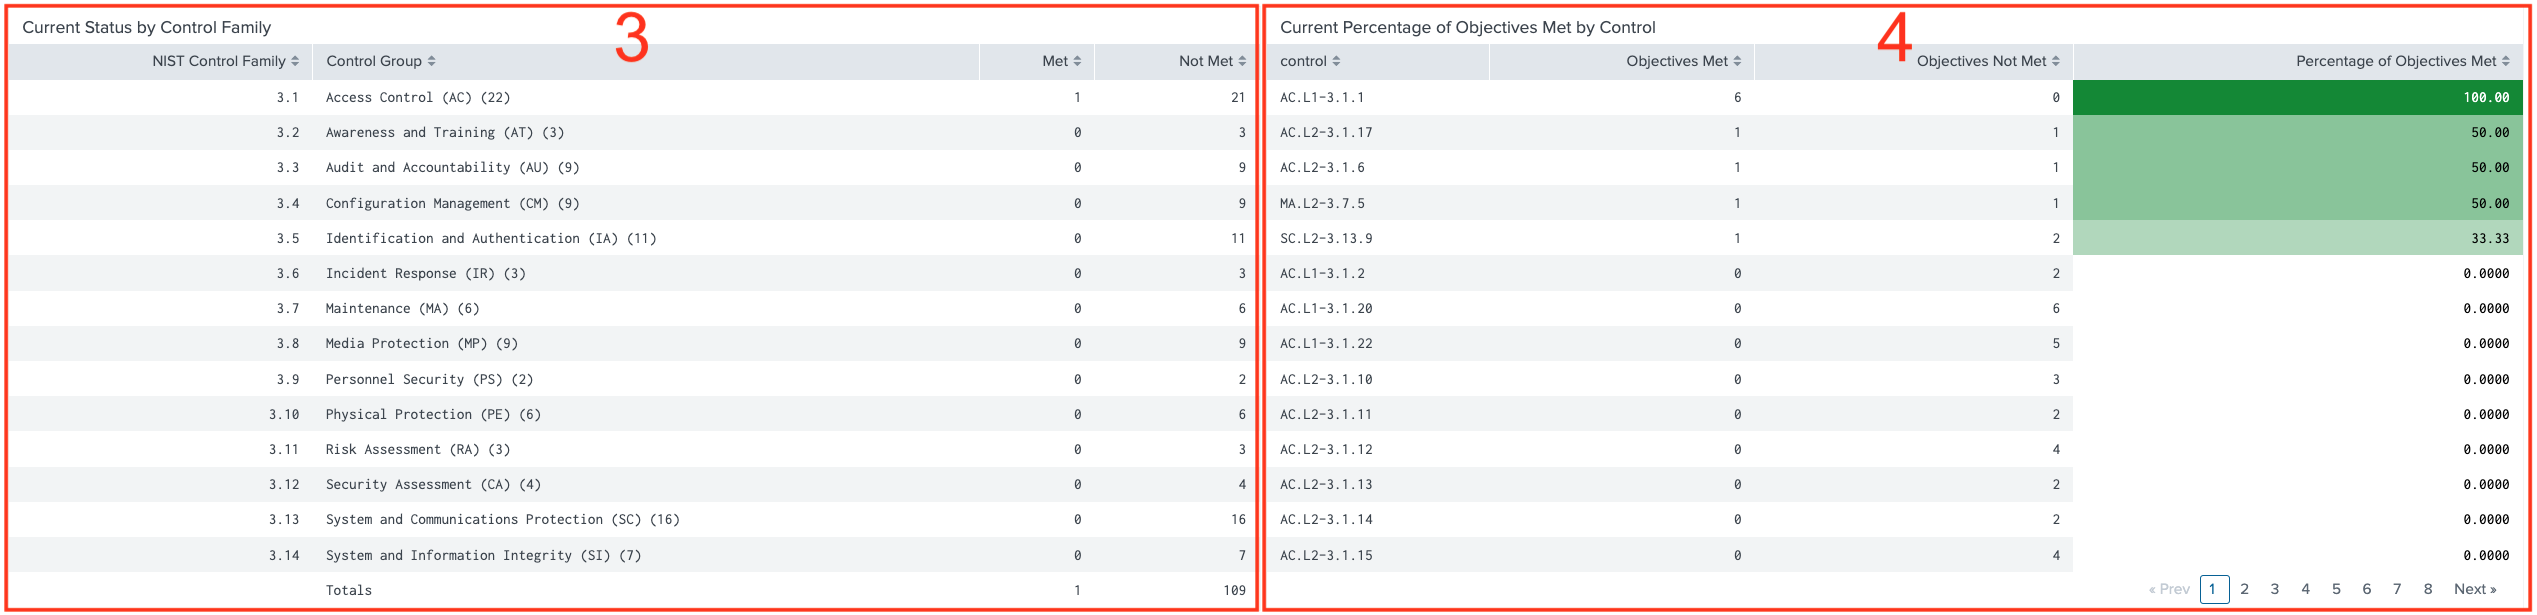
3. Current Status by Control Family Table
In the Current Status by Control Family table, users can explore CMMC domains, along with a breakdown of control statuses within each domain. This table provides a detailed view of compliance status, making it easy to identify areas of strength and areas that require attention.
4. Current Percentage of Objectives Met by Control Table
The Current Percentage of Objectives Met by Control table displays a list of all controls and the numbers and percentage of Met objectives for each control.
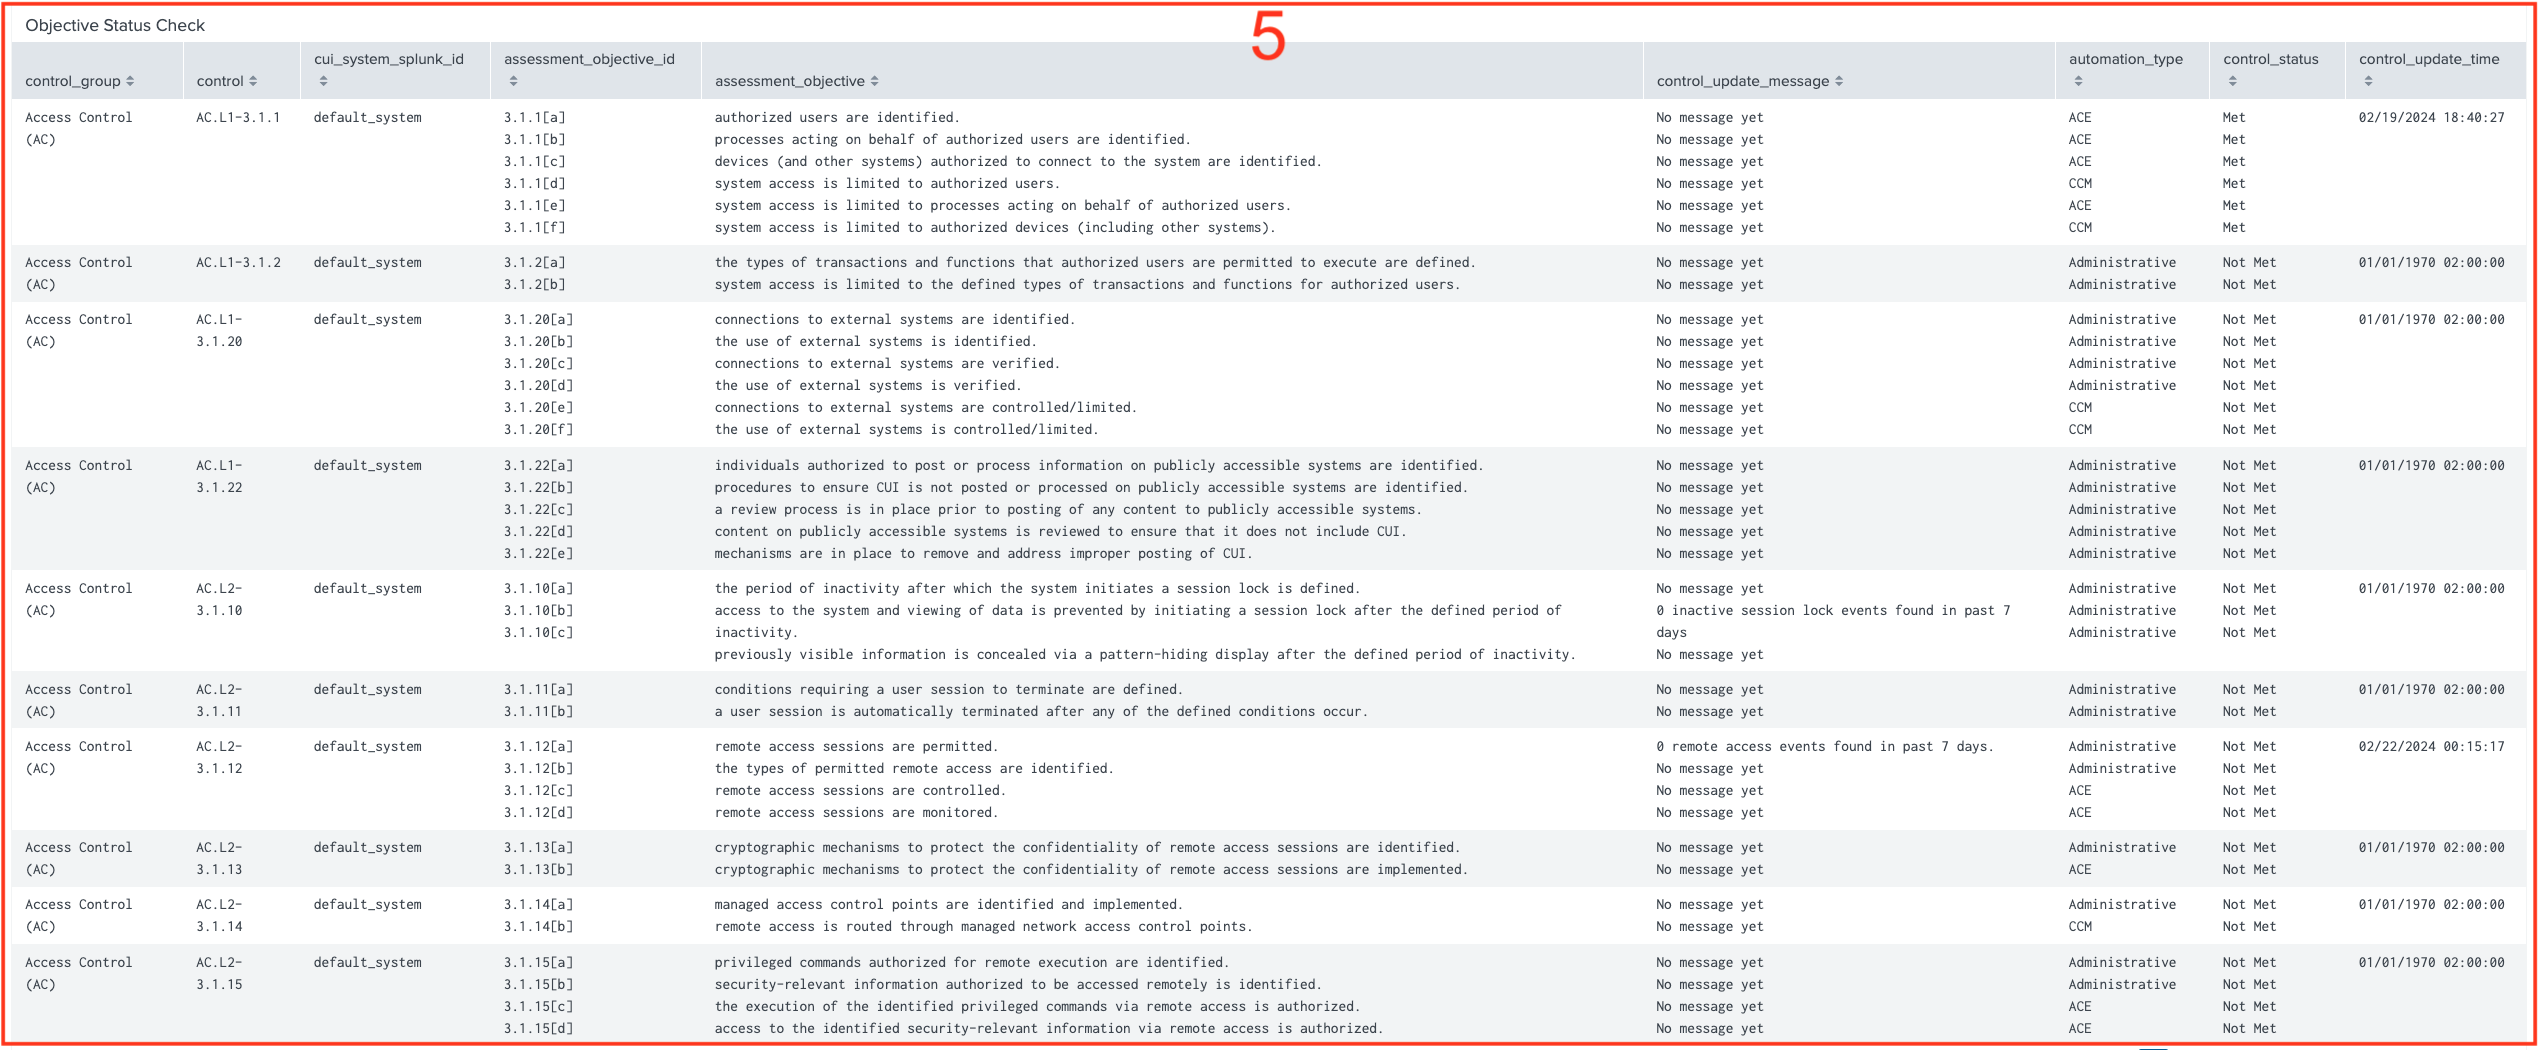
5. Objective Status Checks Table
The Objective Status Checks table lists all controls and their objectives along with details about the objective status.
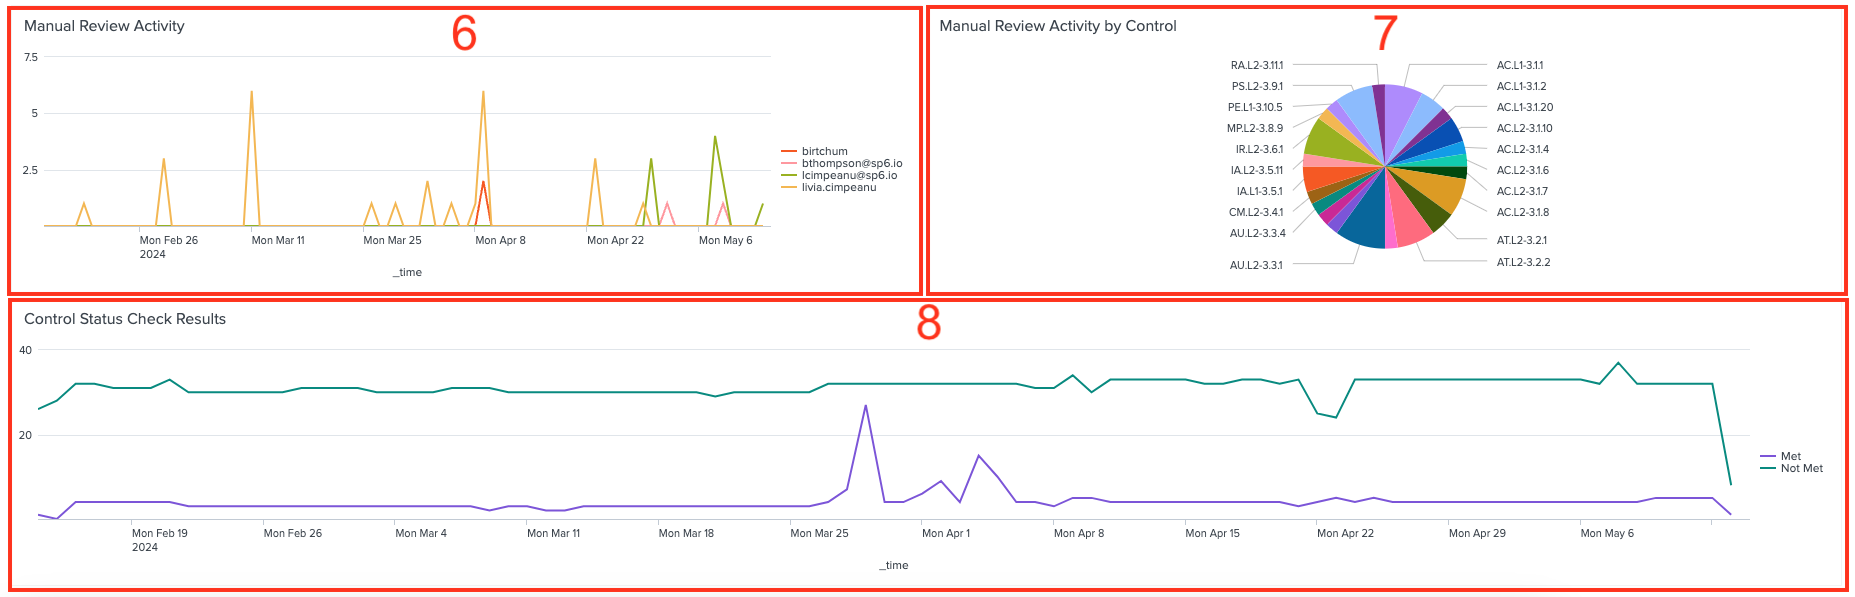
6. Manual Reviewer Activity Chart
The Manual Reviewer Activity chart presents a historical view of manual control reviews over time, highlighting users who have actively contributed to the review process. This chart helps identify key reviewers and their impact on compliance assessments.
7. Reviewer Activity by Control Chart
Similar to the Manual Reviewer Activity chart, the Reviewer Activity by Control chart offers insights into the number of manual control reviews, but this time it provides a breakdown by control. Users can identify which controls receive the most attention and which may require additional scrutiny.
8. Control Status Check Results Chart
The Control Status Check Results chart is a dynamic line chart that tracks the results of ACE checks over time. It visualizes the number of controls with a "met" or "not met" status, enabling users to monitor progress and identify compliance trends.