User Audit Activity
The User Audit Activity page is designed specifically for auditors to monitor and review user activities related to dashboard access and interactions.
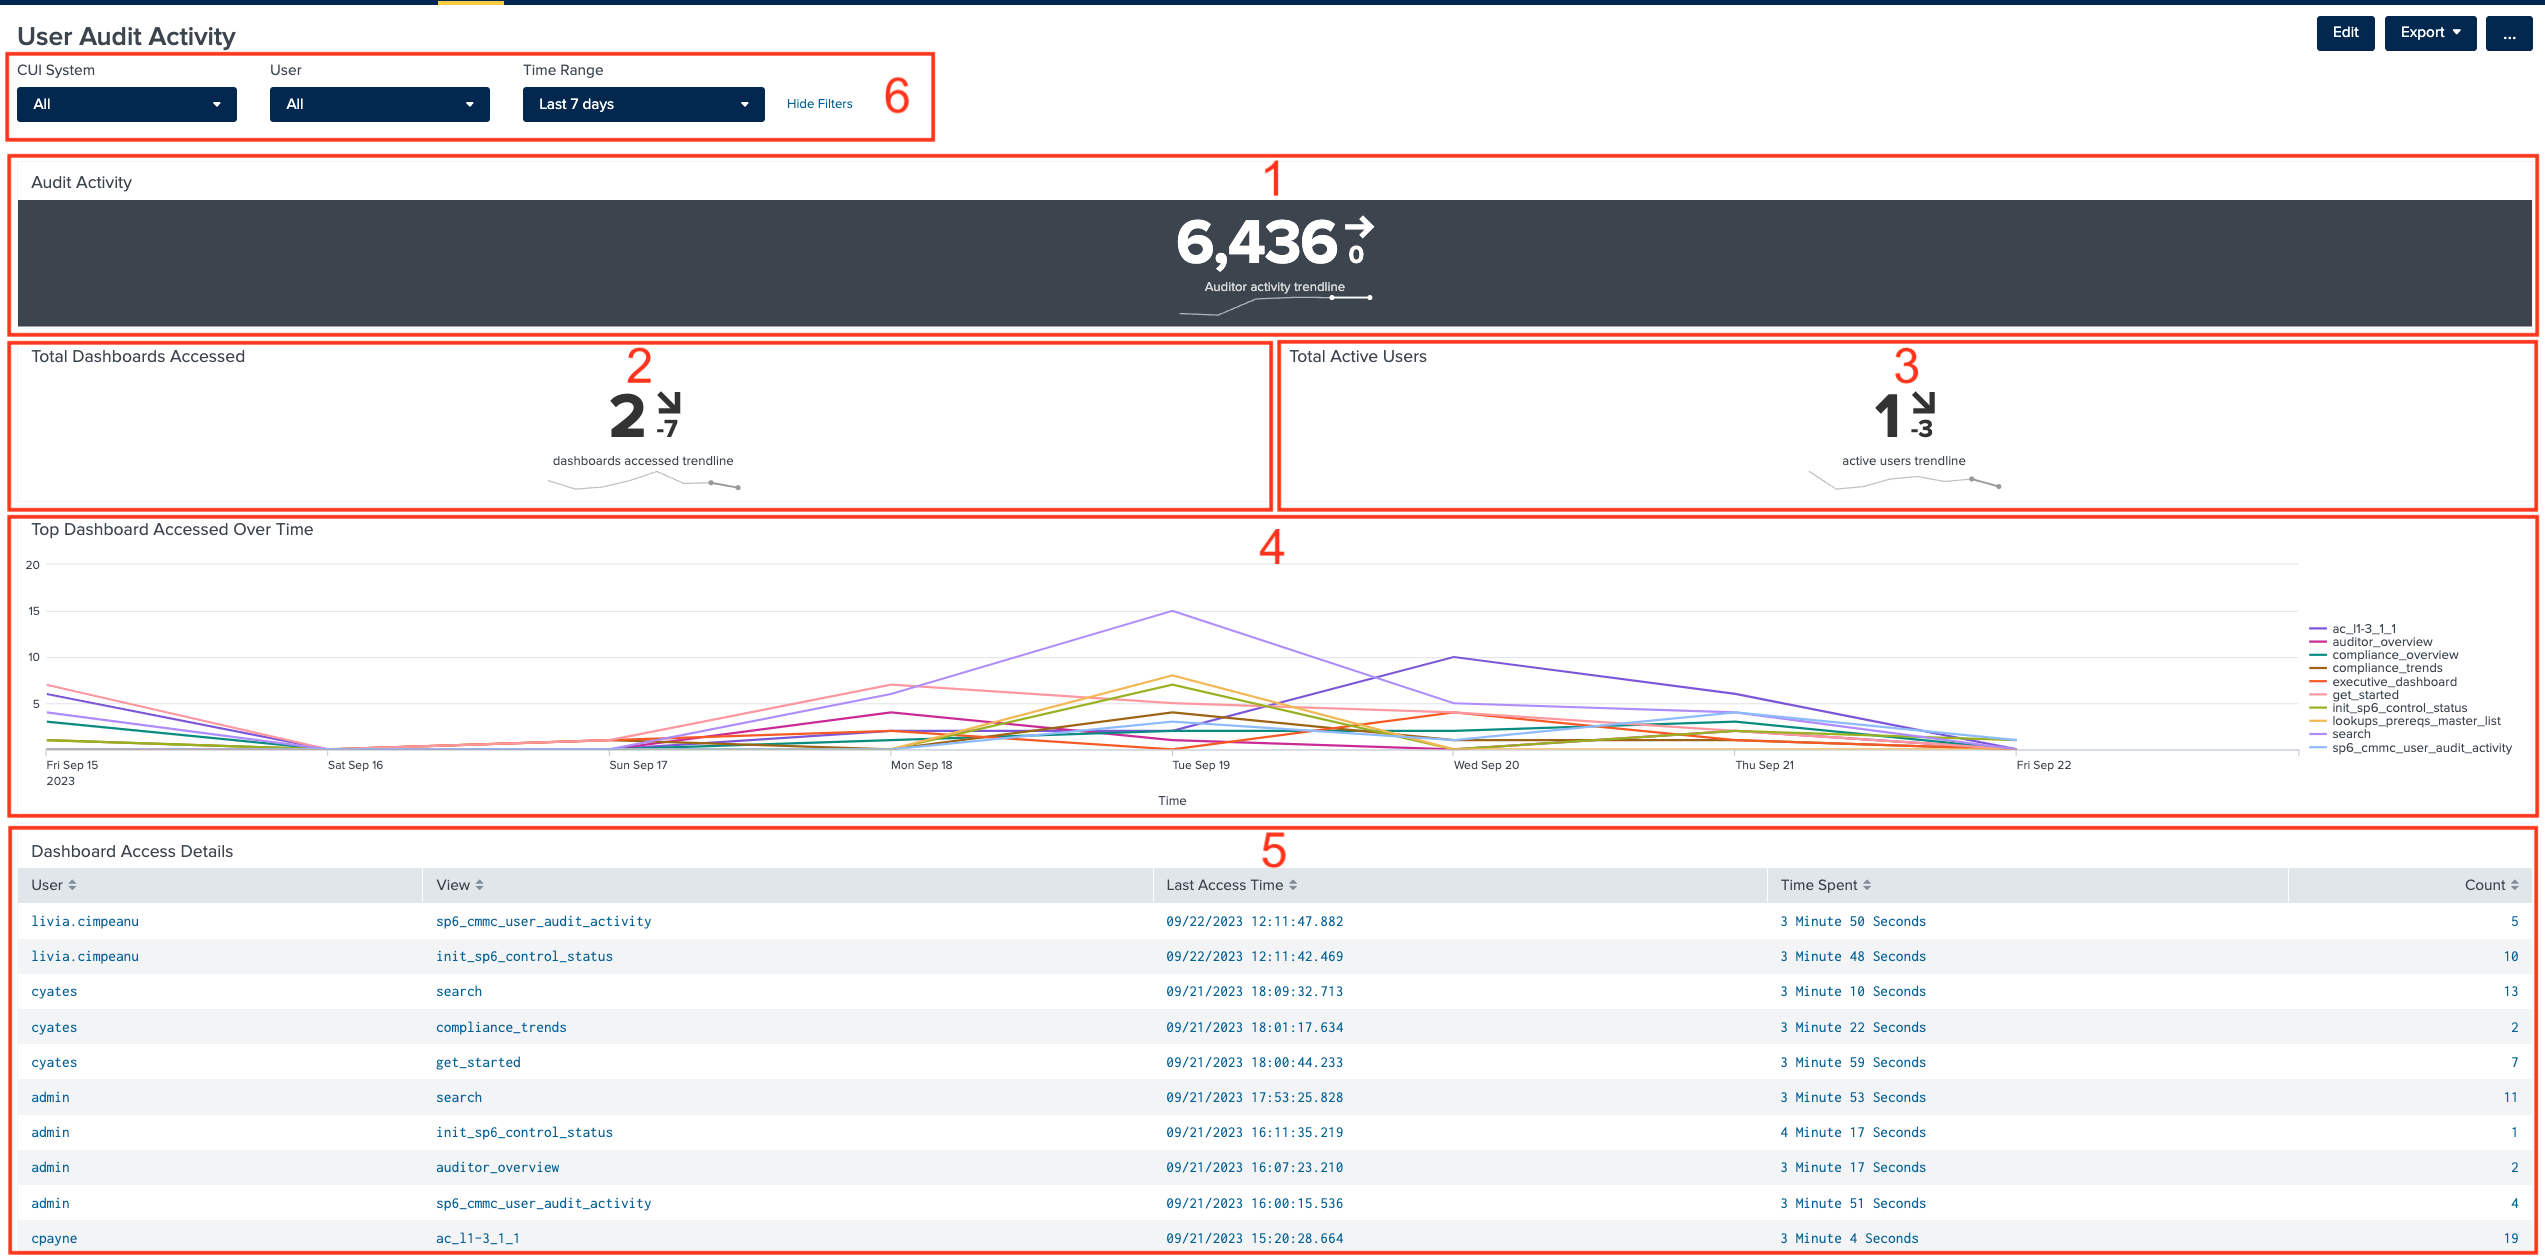
1. Audit Activity
The Auditor Activity Trendline displays the number of activity messages logged during the selected time period. This panel makes visible the activity trends over time, aiding auditors in validating consistent audit activity. Major gaps in data indicate potential issues with the system or user engagement, which may affect data reliability.
2. Total Dashboards Accessed
The Total Dashboards Accessed trendline illustrates the total number of dashboards accessed by all users within the selected time frame.
3. Total Active Users
The Total Active Users trendline presents the count of active users during the selected time period.
4. Top Dashboard Accessed Over Time
The Top Dashboard Accessed Over Time is a line chart that highlights the most frequently accessed dashboards over the selected time frame.
5. Dashboard Access Details
The Dashboard Access Details table provides auditors with in-depth information, including the details of the users that were active in the app, the dashboards that each user accessed, the number of times each user accessed a dashboard as well as details like the amount of time the user spent on a specific dashboard or the last time the dashboard was accessed.
6. Filters
The User Audit Activity page provides a set of comprehensive filters, enabling auditors to fine-tune the information displayed on the page. The auditor can select a CUI system to narrow down the data to review user activities related to that specific system. They also can select a user from the list to gain detailed insights into the actions and interactions of that particular user within the system. Auditors can choose their preferred time period to view data, whether it's for the past week, month, or a custom date range. This filter aids in tracking activity changes over time.